
A company can have underused GPUs, a growing model-API bill and employees who find AI useful. Those facts can coexist. They can also describe a poorly designed operating model. The difficult question is whether the spending will produce enough durable value to justify its cost.
Short answer: the available GPU survey is a meaningful warning about utilization and measurement within its respondent group. It does not establish that the entire AI economy has no demand, that 79% of the world's GPUs are idle, or that an asset-price bubble has definitively burst. The stronger question is where commitments, actual workloads and verified returns have become disconnected.
Evidence cutoff: 31 October 2026. This article reads the supplied Hacker News discussion, the accessible Seeking Alpha summary it links to, VentureBeat's original survey reporting and September research, company financial disclosures and infrastructure documentation. The screenshot supplied by the reader is a collection of search headlines, not underlying evidence. Calculations and decision frameworks below are original illustrations. This is an analysis of business and engineering evidence, not a prediction of stock prices.
First define which AI bubble is being discussed
The phrase combines several different claims.
A valuation bubble concerns prices paid for financial assets relative to supportable future cash flows. Proving it requires assumptions about growth, margins, financing and risk. A useful technology can still be associated with overvalued companies.
An infrastructure overbuild concerns whether capacity, locations, hardware types and financing commitments exceed economically useful demand. Shortages in one region, accelerator generation or service tier can coexist with excess capacity elsewhere.
Enterprise project overinvestment concerns whether an individual buyer has purchased platforms or capacity before establishing a useful workload and a credible return. This is the layer most directly addressed by the supplied survey.
Application-level weak economics concerns whether a product's revenue or internal benefit exceeds inference, engineering, support, review and acquisition costs. A provider can sell substantial compute to applications whose own economics remain weak.
Evidence about one layer should not be silently promoted into a conclusion about all four. Equally, rapid adoption at one layer does not guarantee that every upstream or downstream investment will earn an adequate return.
What the 79% GPU finding actually says
VentureBeat pooled three monthly VB Pulse samples from July to September 2026. Across 385 qualified respondents, 218 were included in the production-GPU utilization analysis. Of those, 172, or about 79%, reported utilization of 50% or less. Within that lower-utilization group, 120 of 172, about 70%, planned a new, additional or replacement compute platform within twelve months. Original pooled report.

Source: VentureBeat Intelligence, July to September 2026 pooled VB Pulse results. Counts refer to respondents in progressively narrower groups, not GPU counts or a representative global company census.
The publication describes different self-selected monthly groups, organizations with at least 100 employees and consultants answering for a main client. The utilization subset excludes non-measurers, non-GPU operators and certain inconsistent July responses. It is not a three-month tracking panel of the same organizations. The pooled analysis also applies an August job-title screen that differs slightly from the standalone August report. Methodology.
Several limits matter:
- A share of respondents is not a share of installed GPU capacity. A small cluster and a large fleet do not receive different weights in that headline.
- The survey is self-reported rather than an independently collected hardware telemetry dataset.
- It did not establish whether respondents owned, rented or accessed the relevant capacity through another provider. The September research explicitly discusses this limitation.
- Planning a replacement platform does not necessarily mean buying additional GPUs or increasing total spending.
- Different monthly samples with similar results do not prove that individual organizations remained underutilized throughout the period.
The separate September report found that most planned adopters lacked a finance-reviewed infrastructure return figure. That indicates a measurement and validation gap. It does not show that every such project had a negative return; absence of a reviewed calculation is different from evidence of a loss. September VB Pulse research.
The appropriate conclusion is narrower and still serious: these respondents reported substantial low utilization while many were considering platform changes, often without validated returns.
Why GPU utilization is technically more complicated than the headline
“GPU utilization” can refer to several different measurements:
Allocated capacity: a scheduler has assigned the GPU to a workload. That does not prove the workload is using it productively.
Engine activity: compute or graphics engines are active during a sampling interval. Activity alone does not tell you whether the application is producing valuable output.
SM activity and occupancy: these describe activity and resident work on streaming multiprocessors. NVIDIA's DCGM documentation explicitly notes that an active warp can be waiting for memory and that higher occupancy does not necessarily mean more effective use.
Memory and Tensor Core activity: a workload can be constrained by memory capacity or bandwidth, or make limited use of Tensor Cores. A single dashboard percentage cannot distinguish all these bottlenecks.
Application throughput: completed requests or tokens delivered within an acceptable latency and quality envelope. This is closer to the service the buyer wants, but still not the final business result. Technical definitions: NVIDIA DCGM.
For an inference service, measure time to first token, time between output tokens, end-to-end latency, queue wait, concurrency, input/output lengths, memory pressure, error rate and successful task completion. Separate workloads by model and request type. A fleet average can hide both overloaded services and idle reservations.
Low average activity can have several explanations
One explanation is weak demand or excessive reservation. Others include deliberate spare capacity for peaks, redundant capacity for availability, a deployment ramp, blocked data pipelines, a model that does not fit the available hardware, or contractual capacity that cannot be changed immediately.
These are engineering hypotheses to investigate, not findings established by the survey. They produce different responses. A demand problem may call for reducing commitments. A data-loading bottleneck calls for pipeline work. A latency-sensitive service may require some headroom even when average utilization looks low.
Do not optimize a service toward 100% utilization by default. In a simple queueing model, waiting time rises sharply as arrival rate approaches service capacity. Real GPU services involve batching and variable request lengths, but the principle remains useful: saturation can increase latency and failure rates. The target is an acceptable cost and service level, not the largest possible dashboard number.
Why idle hardware and high API spending can coexist
Reserved GPU capacity and access to a particular frontier model are different products. An API subscription does not grant the model weights or a license to run that model on arbitrary hardware. Deployment rights and supported hosting options depend on the vendor's actual contract.
An enterprise may therefore pay for a GPU environment built for one workload while users choose a different hosted model for coding, analysis or document work. Moving that usage onto existing hardware requires a deployable model, sufficient quality, compatible serving infrastructure and operational ownership. Hardware availability alone does not satisfy those requirements.
Even where a suitable open-weight model exists, the comparison includes licensing, security review, model updates, evaluation, reliability and staffing. Open weights do not automatically mean unrestricted commercial rights, and a low inference bill does not imply a low total operating cost.
Fortune's August reporting on Uber describes AI spending exhausting an annual budget early and a subsequent emphasis on efficiency. It is an attributed company anecdote reported by a publication, not an audited dataset representing the whole economy. The engineering lesson is useful without making it universal: spending intensity and useful output are different measures. Fortune report.
Does the latest financial evidence prove that the bubble burst?
The supplied Hacker News thread links to a Seeking Alpha argument that interprets capital-spending disappointments and company results as a bubble bursting. The accessible summary is investment commentary. The full argument was behind account access during this review. Hacker News comments challenge parts of the interpretation, but comments are not financial filings. Discussion, accessible opinion summary.
Three distinctions help assess such an argument.
Spending below an analyst estimate is not necessarily falling spending
Alphabet's official Q3 2026 release reports $51.355 billion in quarterly property-and-equipment purchases, compared with $44.924 billion in Q2 2026. That is an increase of approximately 14.3% quarter on quarter, calculated from the company's figures. An analyst could still have expected more. Missing that expectation would be different from reporting a sequential decline. This article does not independently verify the analyst-consensus number quoted in the discussion. Company release and cash-flow reconciliation.
Nor is all company capital spending necessarily AI GPU spending. Buildings, networking, other equipment, delivery timing and financing arrangements affect the comparison. Cash purchases, capital additions and finance leases are not interchangeable accounting measures. A fair cross-company analysis must align them first.
Strong cloud growth is evidence of demand, not proof of adequate returns everywhere
Alphabet reported Q3 Google Cloud revenue of $30.709 billion, up 103% year on year, including meaningful TPU systems sales. Microsoft reported 48% Azure revenue growth in its fiscal Q1 2027, the quarter ended September 2026. These are company-reported results showing demand in broad cloud businesses. Neither is a pure measure of profitable generative-AI consumption, nor proof that every customer's AI investment earns a return. Alphabet release, Microsoft release.
Capacity expansion can be economically justified for one provider while uneconomic for a buyer running a small duplicated stack. Large revenue growth can also coexist with excessive market valuation. These are different questions requiring different denominators and time horizons.
A share-price fall does not isolate the cause
Prices can react to expectations, interest rates, risk appetite, margins, financing and unrelated business changes. To attribute a market-wide correction to an AI demand collapse, investigate underlying demand and cash flows, not just a dramatic headline or one trading session. This article makes no claim about an unverified screenshot price move or a particular stock's fair value.
The defensible verdict is therefore mixed evidence, with a clear enterprise efficiency warning. Claims that the entire bubble has burst, or that no bubble can exist because AI is useful, go beyond what this evidence establishes.
The economic metric should be cost per accepted outcome
For a bounded workflow, define success before measuring cost. An output that requires a full rewrite, sends an incorrect reply or violates a permission boundary should not count as a successful completion.
Cost per accepted outcome =
  all allocated costs for attempted work in the period
  / outcomes that meet the agreed quality standard
The numerator should include failed attempts, retries, model use, retrieval, external tools, allocated infrastructure, human review and repair. Track one-time implementation and migration separately, then include them over the decision horizon. State how shared infrastructure is allocated. The FinOps Foundation similarly recommends cost per successful outcome rather than token cost alone. Practice guidance.
Time saved is not automatically cash saved. A twenty-minute reduction may create useful capacity, improve response time or raise output quality without reducing payroll. Estimate those benefits separately and name the business owner who will validate them.
A transparent hypothetical comparison
Suppose two configurations handle the same eligible workload and each produces 12,000 accepted outcomes per month at the required quality. The following amounts are fictional monthly USD costs, not actual provider prices.
Hosted option: $15,000 for model and tool use, $3,000 for allocated operating costs and $6,000 for review and repair. Total: $24,000, or $2.00 per accepted outcome.
Self-hosted option: $11,000 for capacity commitments, $7,000 for engineering and operations, $2,000 for associated infrastructure and $6,000 for review and repair. Total: $26,000, or approximately $2.17 per accepted outcome.
Now suppose the $11,000 capacity bill is non-cancellable for the next month and has no better alternative use. For the narrow question of where to place the next month's work, the self-hosted option's additional costs are $15,000, or $1.25 per outcome. That can favor using already committed capacity in the short term while the full-cost comparison favors the hosted option for a future renewal.
The reservation has not become free. It remains part of the full cost. If it can be cancelled, resold or repurposed, its avoidable or opportunity cost changes the decision. Do not compare one option's marginal cost with the other's full cost without making that distinction explicit.
What engineering changes can improve the economics?
Fix the actual bottleneck before buying capacity
Trace a representative request across ingestion, retrieval, prefill, generation, tool calls, retries and human review. Measure both cost and elapsed time. A slow database or repeated tool failure may be more important than model inference. Capacity cannot repair the wrong workflow or missing authoritative data.
Cache repeated work where the workload supports it
Prefix caching can reuse computation for shared prompt prefixes. vLLM's documentation distinguishes this prefill benefit from the generation of new tokens: caching does not eliminate decode work. Actual benefit depends on repeated prefixes, cache capacity and request patterns. It is not a blanket reduction in the whole application bill. vLLM documentation.
For application caches, include tenant, permissions, source version and freshness in the design. A cache hit that reveals another customer's data or serves an obsolete policy is not an optimization. Measure invalidation behavior and avoid retaining sensitive content without an appropriate policy.
Route by task and measured quality
Use representative evaluations to decide whether a simpler model, deterministic rule or search result can handle a task. Preserve an escalation route for uncertain cases. Compare cost per accepted outcome and error severity, not a model's token price in isolation.
Do not fill idle hardware with work merely to make utilization look better. Batch evaluation, extraction or indexing is useful only if it has a purpose and does not interfere with latency-sensitive production work.
Add agents only when they improve the result enough
A second agent creates coordination, context and evaluation costs. Parallel work helps when subtasks can be divided and combined reliably; it can hurt when agents duplicate effort or generate conflicting actions. Test a simpler baseline against the more complex system on the same workload. Evaluate actual persisted outcomes, repeated trials and reviewer corrections. Evaluation methods.
Align commitments with observed demand
Track reservations, renewal dates, usage floors and exit costs. Compare stable baseline demand with peaks. A pilot may benefit from flexible capacity even when the unit rate is higher. A mature predictable workload may justify a commitment. The comparison must include quality, service levels, data requirements and the cost of operational ownership.
A practical test before the next AI purchase
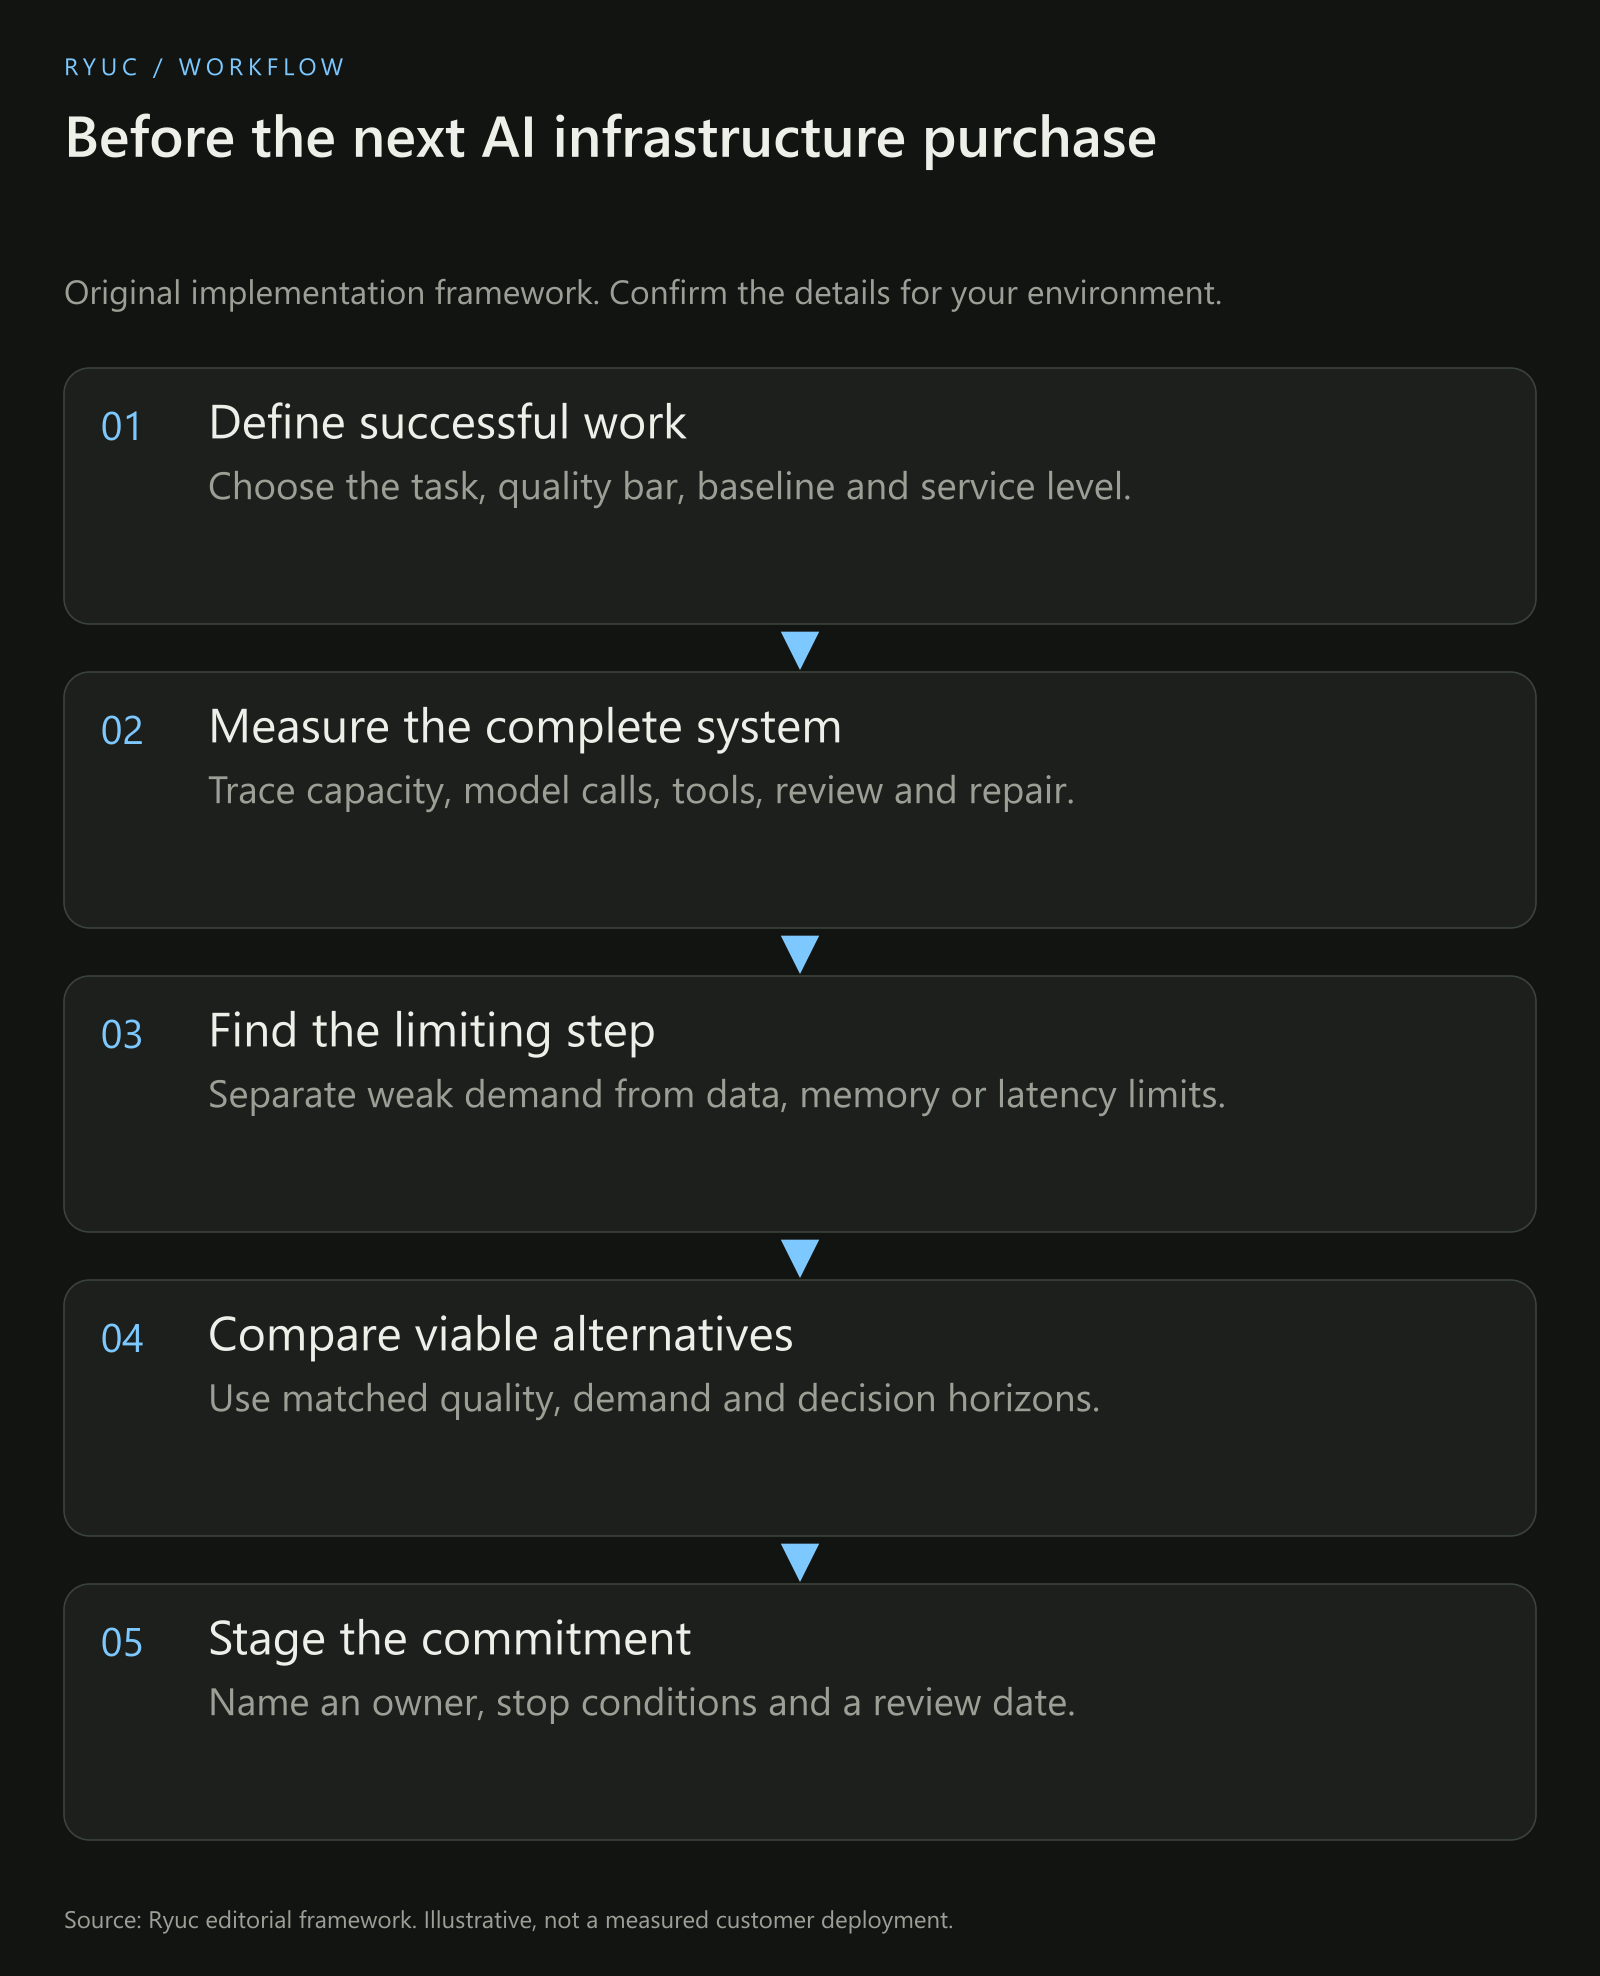
Original decision framework. It does not predict a market crash or guarantee project returns.
Use a written decision record with five sections:
- Workload and baseline: who uses it, task volume, current cost, quality and service requirement.
- Evidence: representative evaluations, production observations, request mix and remaining uncertainty.
- Alternatives: improve the current system, use an API, self-host, replace a platform or stop the project.
- Economics: full and incremental costs, review effort, migration, commitments and sensitivity to demand.
- Decision and review: owner, staged rollout, stop conditions and a date for reassessment.
Vary the assumptions most likely to change the result: accepted-outcome rate, demand, reviewer time, model mix, utilization and engineering cost. A benefit that exists only under a perfect-adoption scenario is weaker than one that survives conservative assumptions.
What would strengthen or weaken the bubble thesis?
The thesis would become more convincing if comparable evidence showed sustained cancellations of economically important capacity commitments, weak end-customer retention, falling realizable compute prices without offsetting cost improvement, deteriorating contribution margins and financing dependent on increasingly implausible demand assumptions.
It would weaken if productive usage, renewal behavior and independently validated workflow benefits grew enough to support the commitments, with improving margins after realistic depreciation, operating and financing costs.
These are proposed indicators to monitor, not claims that all have already occurred. Track comparable periods and distinguish a signed commitment, a backlog, recognized revenue, cash collection and an estimate of future demand. Where a supplier invests in a customer, examine the disclosed financing and purchase terms before treating the resulting activity as independent end-user demand. The structure deserves analysis; it is not by itself proof of fraud.
Several futures remain possible. Some enterprise projects may be cut while efficient hosted providers gain share. Infrastructure may be consolidated and reservations renegotiated while useful applications keep growing. A broader demand or financing shock could produce a more severe correction. Today's survey cannot assign credible probabilities to those outcomes.
What this means for hiring and engineering teams
Budget scrutiny increases the importance of people who can measure and improve a production system: data engineers, platform engineers, evaluation specialists, security engineers and delivery engineers. That does not guarantee hiring growth during a downturn. It identifies capabilities that help a company decide what to keep, improve or stop.
For recruiting workflows, use the same discipline: establish the task, capture evidence, count human review and avoid calling activity a result. Our agentic hiring workflow guide and AI interview scorecard guide apply that principle to screening and hiring operations.
Your next steps
- Read the survey denominator before repeating the 79% claim.
- Separate reserved hardware, hosted model spending and business benefit.
- Measure service quality and cost per accepted outcome together.
- Compare full cost and incremental cost on the same decision horizon.
- Require a documented baseline, owner and review before a major commitment.
Download the AI infrastructure purchase and ROI worksheet.
Frequently asked questions
Does 79% mean most GPUs in the world are idle?
No. It is the share of a screened respondent subset reporting utilization at or below 50%. It is not a hardware-weighted global measurement and does not establish the average utilization of a cloud provider's fleet.
Does low utilization prove the capacity was a bad purchase?
No. Investigate peaks, reliability requirements, ramp-up, contractual restrictions, hardware suitability and actual demand. Persistent underuse without a credible plan is a concern, but the appropriate response depends on its cause.
Does no finance-reviewed ROI mean no value was created?
No. It means the return has not met the survey's particular validation criterion. Benefits may exist but remain poorly measured. That uncertainty still matters when approving another major investment.
Can AI be useful while an AI bubble exists?
Yes. Useful applications, excess capacity and overly optimistic valuations can coexist. Evaluate the specific asset, provider, application and buyer rather than treating the entire ecosystem as one investment.
What should a small business measure first?
Pick one task and record current completion time, quality, review effort and total cost. Run a limited comparison with a clear acceptance standard. A small auditable experiment is more informative than a large platform purchase justified by generic productivity claims.
Sources
- VentureBeat, pooled GPU utilization analysis, 23 October 2026.
- VentureBeat Intelligence, September 2026 AI infrastructure and compute research.
- VentureBeat, September findings analysis, 22 October 2026.
- Hacker News discussion supplied by the reader.
- Seeking Alpha opinion, accessible summary only.
- Fortune, Uber AI spending and efficiency, 7 August 2026.
- Alphabet Q3 2026 official financial results.
- Microsoft fiscal Q1 2027 official financial results.
- NVIDIA DCGM feature and metric definitions.
- vLLM automatic prefix caching and its limits.
- FinOps Foundation, FinOps for AI.
- Anthropic, agent evaluation methods.